Summary
Problem: The setting for this project begins in an expanding Midwestern city. In this city, bus riders are feeling anxious about taking the bus. In the past, one bus served one stop. However, now due to city expansion, multiple busses can serve the same stop, leading to confusion from the bus riders.
Audience: Midwestern bus riders that have a regular schedule and place to be. The bus is one of their main modes of transit.
Solution: Pocketbus provides live tracking updates on busses and provides a clear ETA on where their bus is, and how much time they have to get to their stop. It also provides them info on where their stop is to further minimize anxiety when taking the bus.
Bus riders need to know:
When their bus is arriving.
Where they can get to their stop.
When the bus arrives.

A map of the new bus routes. Multiple bus routes will serve the same stop now, whereas in the past one color served one stop.
Discovery and Research
To get a better sense of bus riders needs, I conducted a survey of 20 participants utilizing Google Forms. Samples included bus riders from the Midwest, Europe and special populations such as the blind.
Some notable stats that came out of the research are:
77%
of bus riders use a transit app to get to their destination.
70%
would take another form of transit due to bus reliability.
30%
reported their arrives on time at or less than half the time.
68%
Would use a live GPS bus tracker if it were available in a bus app.
63%
Would use a list of all available bus routes to plan a trip.
Following up from this quantitative research, qualitative interviews were conducted on bus riders to understand riders thoughts and feelings at a deeper level. Qualitative research corroborated much of the above quantiative research and lead to insights that bus riders behaviors were ultimately driven by anxiety while using the bus.
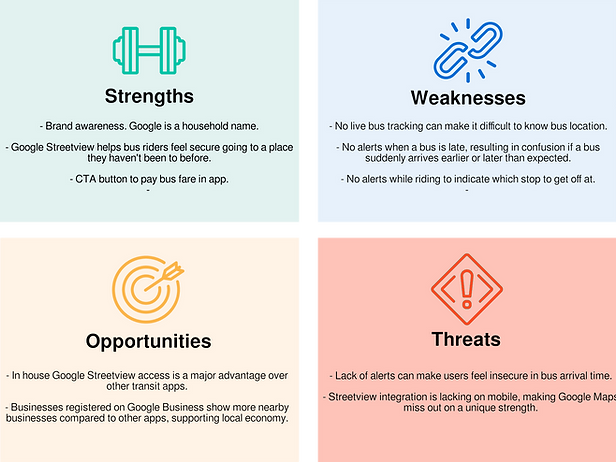
Competitive analysis on transit apps such as Google Maps and Moovit provided more insight into why bus riders continue to feel anxious, despite using these well established apps. These apps don't provide a live transit view of available busses and provide no buffer time between your depart time and bus arrival, resulting in bus riders feeling anxious while using these apps.


Competitive analyses of transit apps Google Maps and Citymapper.

From this research, a persona called Dan was made.
Information Architecture
User Stories:
After creating Dan's persona, user stories were developed based on situations he would be in as a bus rider:
As a bus rider, I want to know when my bus is arriving at the Washington & State bus stop, so I can calculate how much time I have to reach the bus stop.
As a bus rider, I want to know the next bus arriving at the Washington & State bus stop, so that I don’t rush to the bus stop if it is not my bus.
As a bus rider, I want the ability to view future arrival times for any of the seven bus lines (serving Washington & State), so that I know when my bus arrives.
As a bus rider, I want to know when my bus is arriving at the Washington & State bus stop, so I can calculate how much time I have to reach the bus stop.
As a bus rider, I want to know the next bus arriving at the Washington & State bus stop, so that I don’t rush to the bus stop if it is not my bus.
Reflecting some more on Dan and bus riders needs, I developed a user flow so that users could find when their bus is arriving easily.

Initial user flow diagram for Pocketbus.
Prototyping
Low-Fidelity Wireframes
For the low-fidelity wireframes, I chose a design that prioritized the search bar as way to quickly find a route based on where you're going in the user flow. Further, since the majority of bus riders take the bus to the same destinations, I chose to put a saved routes drop down by the search bar so commonly used routes can be easily accessed.
From these paper sketches, low-fidelity wireframes were created in Figma.
Low-Fidelity Prototype
Low Fidelity Usability Testing: Iteration in particular was done on the home screen, where the navigation and and live view changed throughout development. A collapsible menu was added in future iterations. Usability testing indicated that users were able to proceed through the main search flow with no problems. Iteration was needed on the live view screen, where the iconography was unclear.
Low-Fidelity Prototyping was done in Figma.
High Fidelity Prototype
Elastic UI was chosen as the design system for Pocketbus due to its colorblind friendly colors and its versatility. Its components were used while developing the app's menus and routes screens. Lato was chosen for typography due to its clean and inviting tone.
High Fidelity Usability Testing: During usability test, design colors and fonts were perceived positively. In particular the blues chosen stood out to participants. Iteration continued to be needed on the live view screen, since confusion on how to read it remained.
High-Fidelity Prototype of Pocketbus done in Figma.
Final Thoughts
Pocketbus gave me new insights into the transportation industry and how to design user experiences specifically for it.
I developed as a user researcher, exploring surveys as a research methodology and honing user research skills in one on one interviews with worldwide participants.
These skills will be valuable to me in future projects, and I plan to continue honing them as a UX Designer.


